Software
Before and After Control Charts, Pareto Charts and Histograms
In control charts, you can show process changes so that you can see what it was like before and after the improvement

Image Source: gorodenkoff / iStock / Getty Images Plus
Over the last 20 years, I’ve been to a lot of quality conferences and seen a lot of improvement posters. One of the things I’ve noticed is that most posters are only using line and bar charts, which are the dumb and dumber of charts. The people who are using control charts, and Pareto charts and histograms aren’t showing the before and after of the improvement. They might show the before, but they don’t really show the after—how everything changed.
At a quality conference a Baldrige examiner told me that “people applying for the Baldrige show us the before, but they don’t show us the after.” So, let’s talk about how you can show before and after in control charts, Pareto charts and histograms.
Control Charts
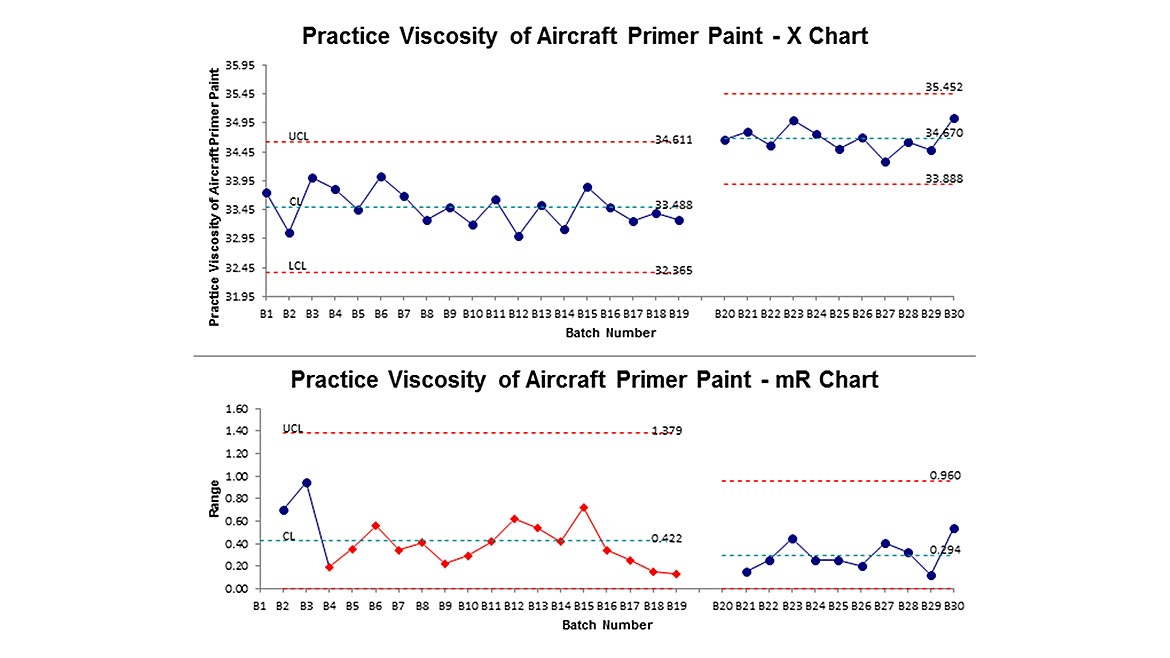
In control charts, you can show process changes so that you can see what it was like before and what it was like after the improvement. If the limits don’t move, you didn’t make an improvement. To show process changes, it’s really by adjusting the values in the center line (average, median, etc.) that changes the limits.
Figure 1 shows an example of a control chart with before and after improvement. Either a run (eight points in a row above or below the center line) or a trend (six points in a row ascending or descending) signal a process shift. With software, you can separate the data by spaces or you can just create the chart and then use the Process Change Wizard to automatically identify trends or runs—the shifts in the process. Great thing about this is people can clearly see yes, it was low before and afterwards it improved.
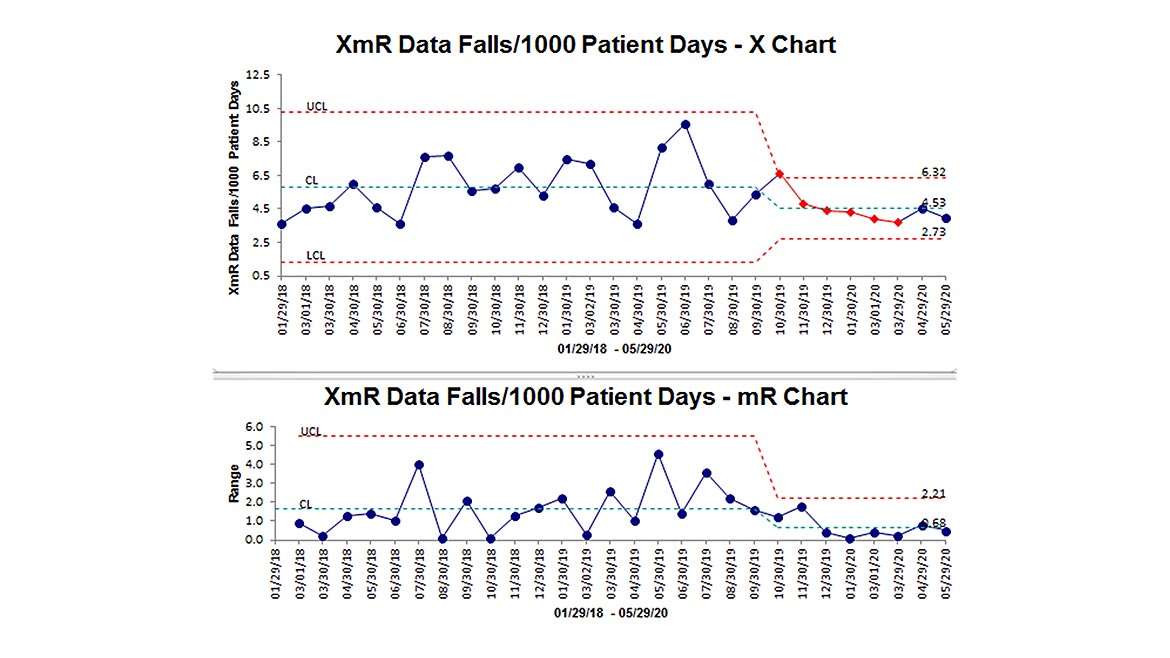
Healthcare and other service industries can use control charts with process changes. Figure 2 shows a process shift in patient falls after an improvement project.
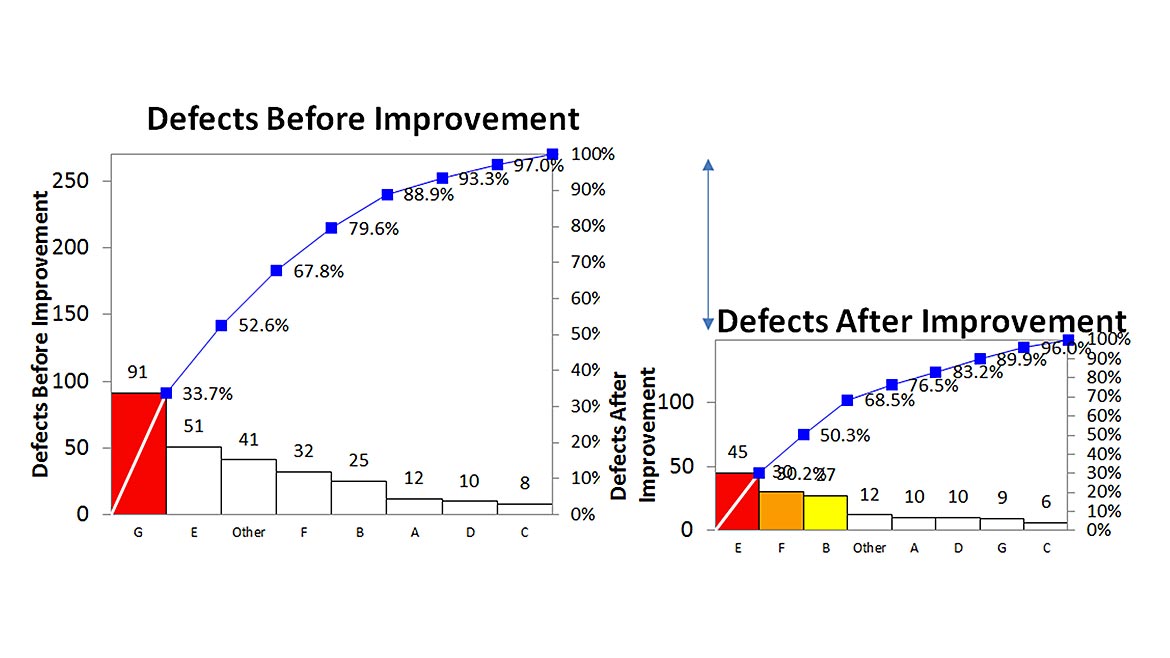
You can also do the same with Pareto charts Figure 3. You can measure all of the contributors the problem beforehand, and then we can measure all the contributors after. Then you can draw Pareto chart of each one and show them side by side. Then you can collapse the Y axis of the after chart to show how much it reduced the problem. In this example, the big bar, “G” reduced from 91 to 9, a significant improvement.
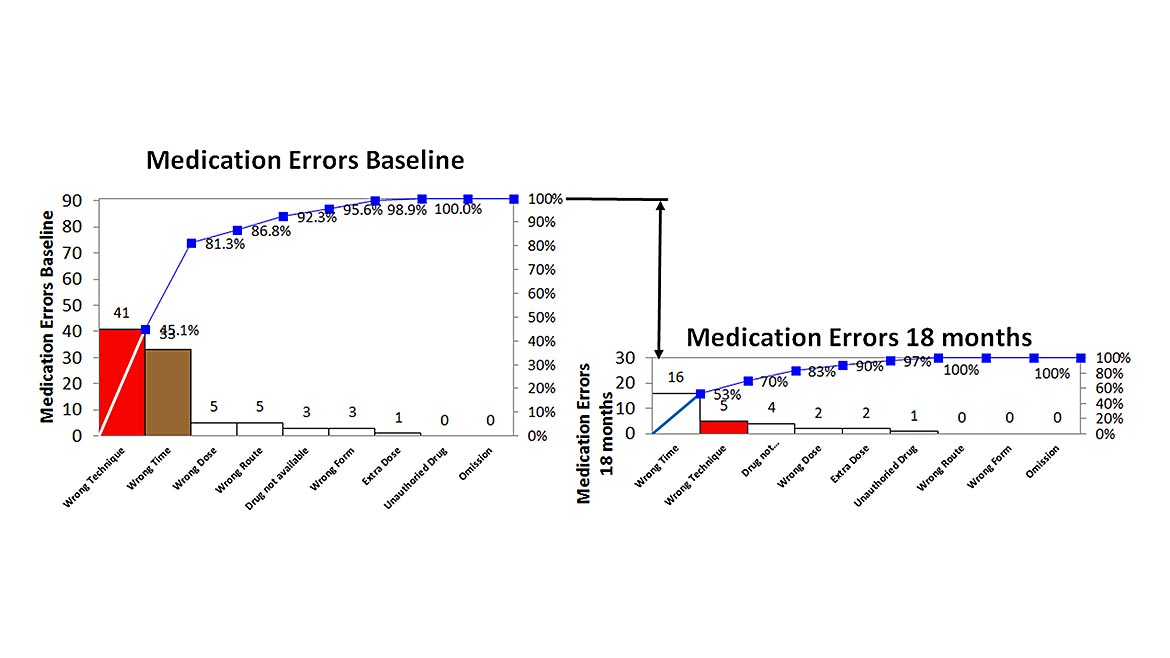
This can also be done with healthcare data about common problems such as medication errors before and after improvement (Figure 4). In this case, wrong technique fell into second place. Next the team can work on reducing “wrong time” problems.
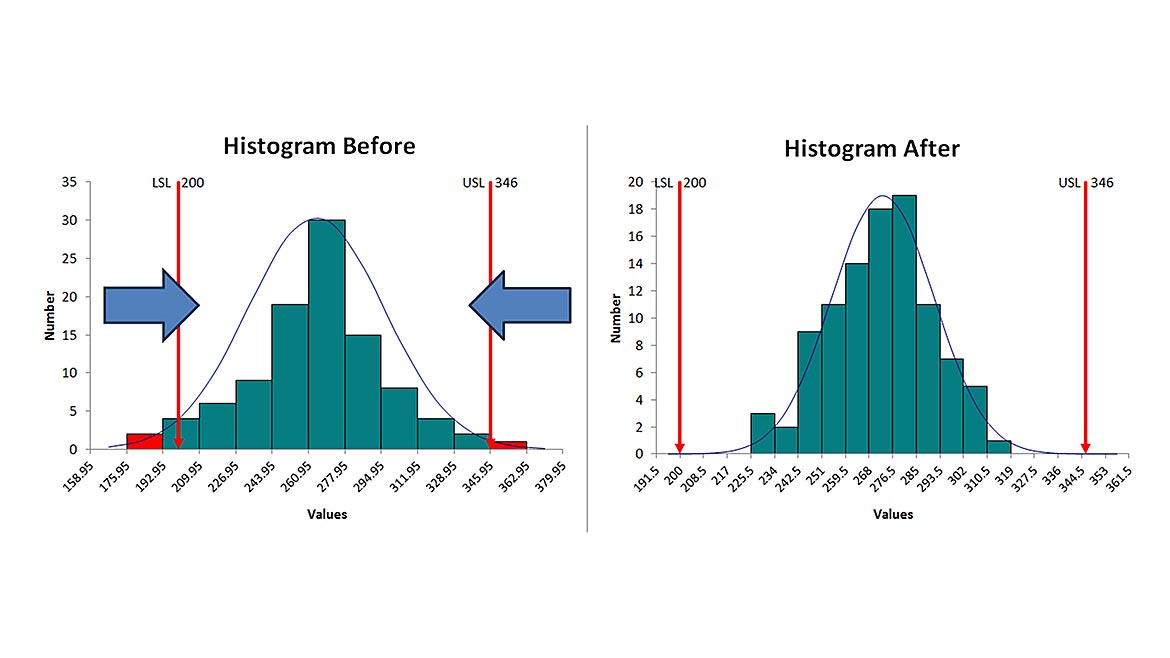
You can also do this with histogram. You can draw histogram before improvement, where things were out spec, beyond the upper or lower specification limit. And then you can change the process and show it again afterwards showing that all the data is now inside of the spec limit. And you can stand these side-by-side and show how it’s actually been improved Figure 5.
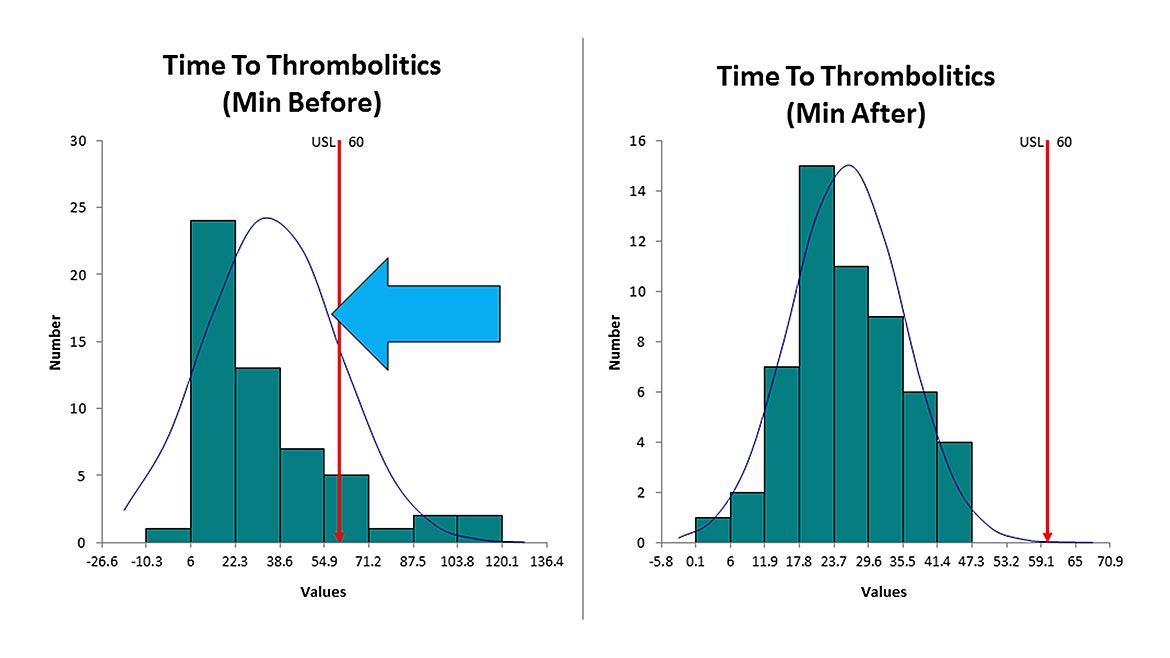
Similarly, this can be done with one-sided specification limits such as time to thrombolytics (a clot busting drug) used in healthcare (Figure 6).
These are the kinds of things to look for when evaluating improvement projects. Did the baseline control chart improve? Did the big bar in the Pareto chart move to the second or third position? On a histogram, did it move all the data inside of the spec limits? Did we get a Cp and Cpk that’s 1.33 or 1.66 or higher? 1.3 is four sigma; 1.66 is five sigma 2.0 is six sigma.
Before and After Charts in Improvement Projects
These before and after charts are key to a good an improvement project. I so rarely see them in improvement project posters. At recent conferences, I’ve seen hundreds of improvement posters. There are maybe two control charts, a handful of Pareto charts and occasional histogram. Rarely do they show the before and after. Let’s start using before and after charts to show how an improvement project has saved time, saved money and saved lives.
Looking for a reprint of this article?
From high-res PDFs to custom plaques, order your copy today!