Quality Magazine logo
search
cart
facebook twitter linkedin youtube
  • Sign In
  • Create Account
  • Sign Out
  • My Account
Quality Magazine logo
  • NEWS
  • PRODUCTS
    • SUBMIT YOUR PRODUCT
  • CHANNELS
    • AUTOMATION
    • MANAGEMENT
    • MEASUREMENT
    • NDT
    • QUALITY 101
    • SOFTWARE
    • TEST & INSPECTION
    • VISION & SENSORS
  • MARKETS
    • AEROSPACE
    • AUTOMOTIVE
    • ENERGY
    • GREEN MANUFACTURING
    • MEDICAL
  • MEDIA
    • A WORD ON QUALITY PUZZLE
    • EBOOK
    • PODCASTS
    • VIDEOS
    • WEBINARS
  • EVENTS
    • EVENT CALENDAR
    • QUALITY SHOW
    • IMTS
  • DIRECTORIES
    • BUYERS GUIDE
    • NDT SOURCEBOOK
    • VISION & SENSORS
    • TAKE A TOUR
  • INFOCENTERS
    • NEXT GENERATION SPC & QUALITY ANALYTICS
  • AWARDS
    • ROOKIE OF THE YEAR
    • PLANT OF THE YEAR
    • PROFESSIONAL OF THE YEAR
  • MORE
    • eNEWSLETTER
    • INDUSTRY LINKS
    • THE LEADERSHIP SURVEY
    • CLASSIFIEDS
    • MARKET RESEARCH
    • PRODUCT SPOTLIGHTS
    • QUALITY STORE
    • WHITE PAPERS
  • EMAG
    • eMAGAZINE
    • ARCHIVES
    • CONTACT
    • ADVERTISE
  • SIGN UP!
Home » Keywords: » control charts

Items Tagged with 'control charts'

ARTICLES

An engineer holds a laptop with mock-up charts. In the blurred background, three people are working together at a desk.
Software

Before and After Control Charts, Pareto Charts and Histograms

In control charts, you can show process changes so that you can see what it was like before and after the improvement
Jay Arthur
April 30, 2025

Over the last 20 years at conferences, I've noticed many improvement posters rely on line and bar charts, which aren't always effective. While some use control charts and histograms, they often miss illustrating the "before and after" of improvements. It's crucial to better showcase these changes with appropriate chart types.


Read More
Electronics Design Factory: Male Engineer Wearing Safety Vest Working on Computer.
Software

Adding Confidence to Your Capability Estimates

The control chart provides an extremely critical role in capability estimates.
Paul Keller
January 22, 2025

A customer inquired about confidence intervals for capability indices, emphasizing their role in process capability reporting. The capability index, often represented by Cpk, estimates how well a process metric meets customer requirements.


Read More
A young  African American woman doing paperwork in a modern office.
Software

Control Charting Integration with Process Capability and Enhanced KPI Reports

If there are common causes of variability and the product is not meeting customer needs, process improvements are needed to improve the product quality.
Forrest Breyfogle Adilson Inocencio
November 15, 2024

Traditional control charting techniques, despite their long history, can lead to wasteful outcomes due to certain mathematical properties. This article examines these issues using a Minitab dataset and introduces a free 30,000-foot-level metric-reporting app as an alternative, supported by Minitab analyses.


Read More
QTY 0722 Minitab iC Editorial Topic 1

Best Practices When Implementing SPC Charts

Control charts should be implemented carefully. Here are best practices to keep in mind.
July 13, 2022

The Xbar/R Control Chart is a method of Statistical Process Control (SPC) manufacturers can use to reduce fill weight variation, maintain centerlines and avoid rework. Here are best practices to keep in mind:


Read More
QTY 0222 Minitab IC MAINIM_1.JPG
Sponsored Content

Detect Small Shifts in the Process Mean with Exponentially Weighted Moving Average (EWMA) Charts

Quickly detecting small shifts in mature or highly sensitive processes is where the EWMA control chart really shines.
February 7, 2022

Early detection of small shifts in the manufacturing process enables you to react faster and fix the process, saving time and money.


Read More

Control Charts 101

Control charts are straightforward tools that help operators understand process variability. They do this by identifying four process states.
DarrylSeland_200
Darryl Seland
January 7, 2022

SPC control charts are essential quality control tools. Operators use them to measure, regulate, and make manufacturing processes consistent.


Read More
people in ppe looking at a laptop in an industrial setting

Control Chart Analysis

An example.
Paul Keller
February 8, 2021

An SPC (Statistical Process Control) Software customer recently inquired if I could discern any issues in a process, as their customer had identified problems with three recent shipments. They provided data for the customer’s current year shipments for a variety of KPI (key process indicators) in an Excel file. 


Read More
Shewhart Bowl

The Past is Here

Before you leap forward into another eventful year, let's look back.
January 8, 2020

The holiday season is over. You made it! You can take a breath. You are ready for the hustle and bustle of 2020. There will be new projects, challenges, and successes.


Read More
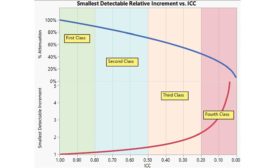
Figure 1: Measurement System Quality (ICC) vs. Attenuation.

The Cost of a Poor Measurement System

Convince people of the value of measurement system analysis.
William D. Kappele
July 1, 2017

Quality professionals know the value of good measurement systems. They know that without trustworthy, high quality data you cannot make good business decisions. Unfortunately, most business people and many engineers don’t understand this value.


Read More
The Cloud Paradigm

Software & Analysis: The Cloud Paradigm

Devin Brent Ellis
September 7, 2012
Bring distributed quality intelligence data from the shop floor to your quality management system.
Read More
Subscribe For Free!
  • eMagazine Subscriptions
  • eNewsletters
  • Online Registration
  • Subscription Customer Service
  • Manage My Preferences

More Videos

Popular Stories

Technician working with the Vision Engineering LVC200.

Difference Between Calibration and Verification

Woman working in quality control, measuring a workpiece.

AI’s Double-Edged Sword: Security and Compliance in Manufacturing

QM0525-FEAT-A3-Automation-p1FT-Quality-Inspection.jpg

The Next Frontier of Automation: Quality Assurance in an AI-Driven Era

May 21 Quality Hexagon Live Webinar

Events

May 21, 2025

The Evolution of Laser Radar: Measuring Large Scale From Distance With High Accuracy

This webinar, featuring a live demonstration, will showcase the evolution of Hexagon’s direct scanning laser trackers: cutting-edge technology that now delivers traditional reflector-tracking accuracy to non-contact, large-part scanning.

View All Submit An Event

Products

Lean Manufacturing and Service Fundamentals, Applications, and Case Studies

Lean Manufacturing and Service Fundamentals, Applications, and Case Studies

See More Products
Play Quality's captivating word-guessing game! There's a new word every Friday.

Stay in the know with Quality’s comprehensive coverage of
the manufacturing and metrology industries.

eNewsletter | Website | eMagazine

JOIN TODAY!
  • RESOURCES
    • Advertise
    • Contact Us
    • Directories
    • Store
    • Want More
  • SIGN UP TODAY
    • Create Account
    • eMagazine
    • eNewsletter
    • Customer Service
    • Manage Preferences
  • SERVICES
    • Marketing Services
    • Market Research
    • Reprints
    • List Rental
    • Survey/Respondent Access
  • STAY CONNECTED
    • LinkedIn
    • Facebook
    • YouTube
    • X (Twitter)
  • PRIVACY
    • PRIVACY POLICY
    • TERMS & CONDITIONS
    • DO NOT SELL MY PERSONAL INFORMATION
    • PRIVACY REQUEST
    • ACCESSIBILITY

Copyright ©2025. All Rights Reserved BNP Media.

Design, CMS, Hosting & Web Development :: ePublishing