Test & Inspection
How Much Does That Calibration Test Really Cost?
The true cost of calibration testing often stays hidden, escaping scrutiny in operational and maintenance metrics.
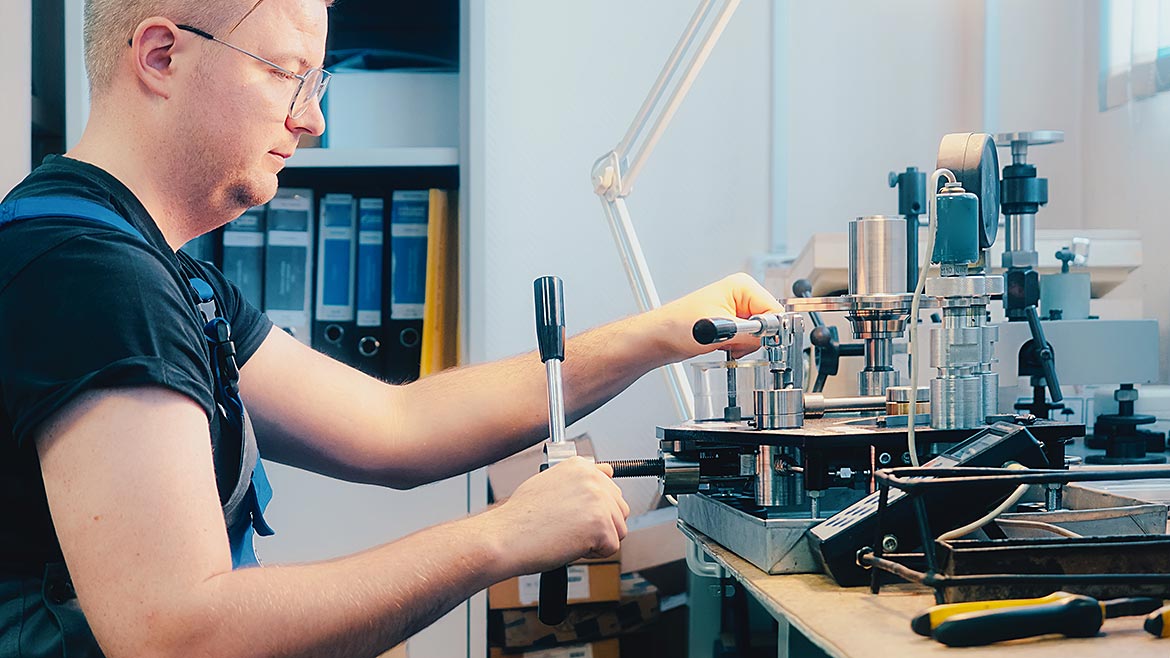
Image Source: Sergey Pakulin / iStock / Getty Images Plus
Calibration lab managers and sales teams typically quote customers based on ideal conditions—assuming the test passes, with minimal risk, everything in tolerance, and no adjustments required. As a former lab manager, I can confirm this isn’t always the reality. The true cost of calibration testing often stays hidden, escaping scrutiny in operational and maintenance (O&M) metrics.
When these hidden costs surface, some managers quickly blame the lab for delays. Yet, by leveraging risk control tools, investing in high-quality test equipment, and making smart decisions about adjustments, labs can effectively reduce these concealed costs.
In this example, we analyze a recalibration test of an “Acme” model 123 Digital Multimeter (DMM) using an “Acme” Multifunction Meter Calibrator (MMC) as the reference standard. The test includes 22 Test Points (TP) with a maximum Probability of False Accept (PFA) of 2%. It takes one hour, costing $200 (including salary and benefits). We focus on the Probability of False Reject (PFR) risk, as the lab cannot quantify the cost of falsely accepting an item, but PFR can be measured and tracked for a more accurate understanding of recalibration costs.
The PFA and PFR formulas, based on a complex bivariate cumulative distribution function, are included in an unprotected Excel workbook available for download, allowing users to explore these functions. The omitted PFAGBMult function, which calculates a guard band multiplier for symmetrical or asymmetrical tolerances using a bisection routine, can be referenced in the VBA code within the Excel file. This multiplier adjusts test tolerance to manage compliance risk.
The document emphasizes PFR over PFA for cost analysis because PFR can be tracked and quantified by the lab, whereas the cost of falsely accepting an out-of-tolerance (OOT) item is borne by the customer and thus unknowable to the lab.
To make this a meaningful metric, a few setup parameters need established. These are
- The loaded hourly internal billing rate: $200
- Estimated re-calibration testing time: 1 hour
- Maximum allowable risk, known as PFA, which is a value of 2% typically. This value ensures that any items calibrated by the service lab have an in-tolerance probability of 98%
- The initial in-tolerance probability of the Unit Under Test (UUT)
- If true historical information is available about the actual EOPR of the UUT, enter that known value. (e.g. 95%)
- If no information regarding EOPR of is known or available, the conservative estimate for EOPR is ~91.67%. This is derived from the normal distribution function for the SQRT(3). Using Excel, it is = 2 * NORM.S.DIST(SQRT(3),1) – 1
- If true historical information is available about the actual EOPR of the UUT, enter that known value. (e.g. 95%)
- Test Points (TPs): 22, measured against an “Acme” Multifunction Meter Calibrator (MMC)
Process:
With inputs entered, we:
- Create a TP data sheet
- Assign reference standards
- Perform uncertainty analysis
- Calculate PFR
- Enter “as-found” measurements
- Determine tolerance status (blank for in-tolerance, “FAIL” for out-of-tolerance)
Workbook Details:
The downloadable Excel workbook contains all setup formulas and a random function, NORM.INV(RAND(), Nominal Value, Expanded Measurement Uncertainty), to simulate UUT failures. Only results and costs are shown here. Press “F9” to update OOT values.
The results for our test data are shown below in Table 1
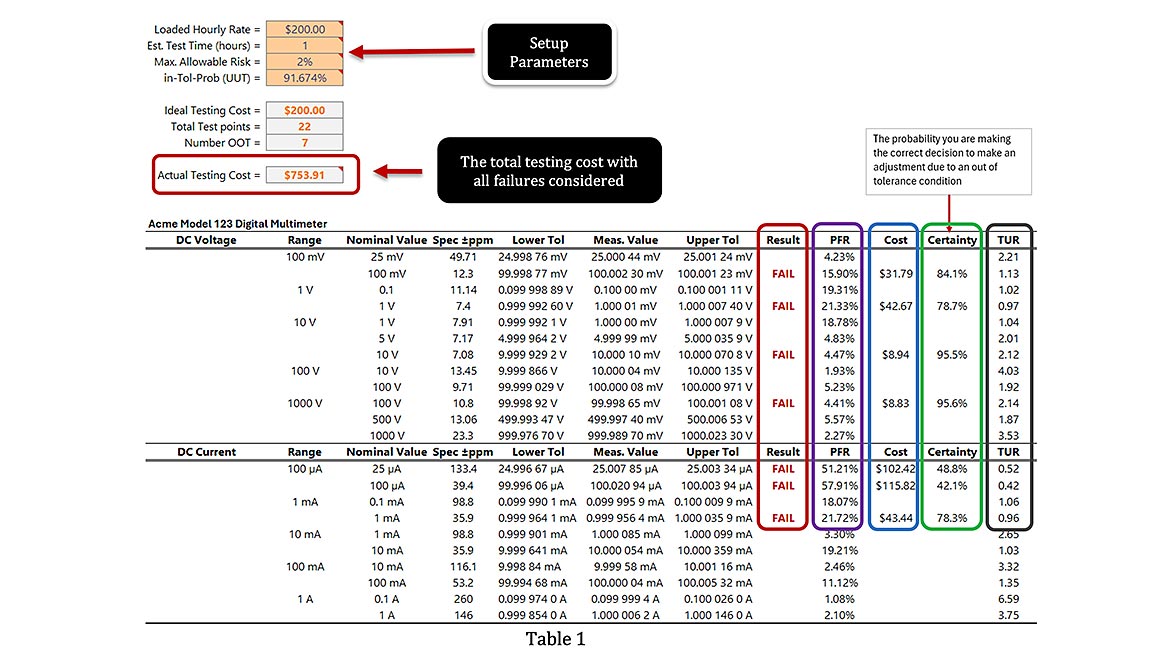
Table 1 Explanation:
- Result Column: 'FAIL' indicates the test point (TP) is out of tolerance.
- PFR Column: Shows the Probability of False Reject (PFR) for each TP, indicating risk level.
- Cost Column: Calculates cost for each failed TP as $200 × PFR.
- Certainty Column: Reflects confidence in correctly identifying an out-of-tolerance (OOT) condition and deciding to adjust (e.g., 48.8% for 25µA and 42.1% for 100µA on the 100µA range).
- TUR Column: Test Uncertainty Ratio (TUR) = (UUT tolerance span) / (2 × expanded uncertainty), as shown in Figure 1.
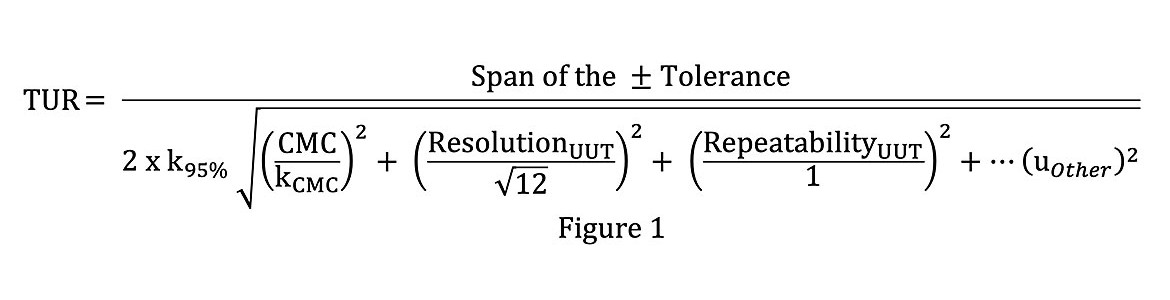
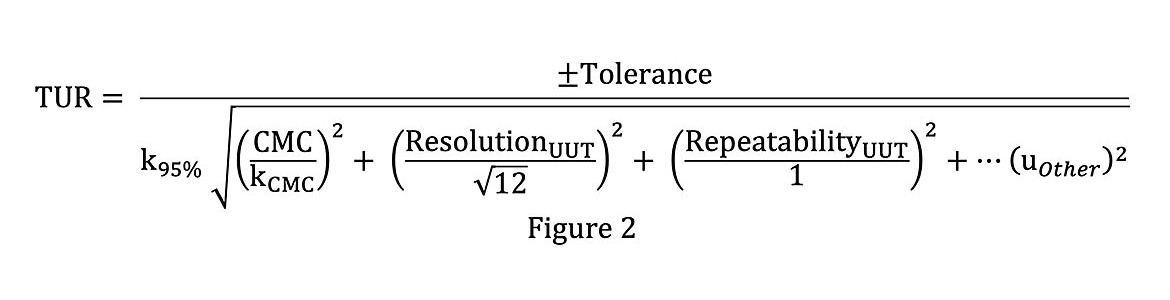
The divisor consists of all the applicable uncertainty contributors. For symmetrical specifications, it can be expressed as shown in figure 2 and provides the same result (the span being replaced by a single ± tolerance and divided by the expanded uncertainty).
Ideally, the TUR should be held at a value of 4.0 or greater as this provides the highest confidence if any TP is OOT. This higher value provides ~98% certainty the OOT condition is truly OOT and likely requires adjustment.
The Actual Testing Cost (top left area) consists of the initial calibration cost + sum of costs due to failed TPs (calibration cost x PFR) + As-Left verification. The ideal calibration cost went from $200 to an actual $753.91.
Should any out-of-tolerance (OOT) conditions arise, the recalibration cost will double to $400; however, the primary focus remains on failed test points (TPs) with low confidence in identifying OOT status and determining necessary adjustments. These failed TPs represent a hidden cost that many lab managers and sales representatives often overlook when providing recalibration service quotes.
Conclusion
The true cost of calibration testing often surpasses the initial quote due to hidden expenses tied to test point failures and the adjustments they necessitate. By focusing on the Probability of False Reject (PFR), labs can quantify these concealed costs and make strategic decisions about whether to adjust instruments. Employing risk control tools, investing in high quality test equipment, and maintaining a Test Uncertainty Ratio (TUR) of 4.0 or greater are critical steps to minimize these costs and boost decision-making confidence. As shown in the recalibration of the “Acme” model 123 Digital Multimeter, what starts as a $200 test can rise to $753.91 when PFR-related risks are factored in. This deeper insight into calibration expenses not only refines cost accuracy but also underscores the value of equipment upgrades, paving the way for enhanced lab efficiency and greater customer confidence.
Looking for a reprint of this article?
From high-res PDFs to custom plaques, order your copy today!