Software
Adding Confidence to Your Capability Estimates
The control chart provides an extremely critical role in capability estimates.

Image Source: gorodenkoff / iStock / Getty Images Plus
A customer inquired recently about confidence intervals on capability indices, and I was reminded of how useful they are when reporting a process capability index. A capability index is a statistic that estimates how well a particular process metric will meet a specified customer requirement, expressed as a numerical specification. The most common capability statistic is Cpk, which is calculated for a given process dimension as shown in Equation 1.
Cpk= Min [(USL-m)/3s, (m-LSL)/3s] (1)
The variable m is the process mean, and s is the process standard deviation, each calculated from a set of process data. The upper specification limit (USL) and lower specification limit (LSL) are generally specified by the customer for each product and/or process dimension.
The Cpk calculation above is valid for a stable process that has a normal distribution. The process mean and process standard deviation are derived from a control chart, which is used to verify the requirement of process stability. The process standard deviation should not be confused with the sample standard deviation, such as calculated using Excel’s STDEV.S function or Minitab’s Pooled Standard Deviation option, or the population standard deviation (Excel’s STDEV.P function). Each of these estimates is inappropriate for use in the process capability Cpk calculation.
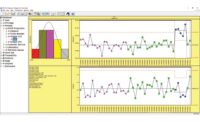
An X-Bar / Range control chart for a process metric is shown in Figure 1. The process is in statistical control: There are no subgroups plotted outside of the control limits, which are calculated based on the data. The process observations are adequately modelled by the normal distribution, as evidenced by the K-S (Kolmogorov-Smirnov) value of 0.71, which greatly exceeds the threshold of 0.05. The calculated process mean is shown on the chart as 350.54, the calculated process standard deviation as 9.04, the required USL as 383 and the required LSL as 318. The Cpk is calculated for this process data as:
Cpk= Min [(383-350.54) / (3*9.04), (350.54-318) / (3*9.04)] = 1.2
A Cpk value of 1.0 implies that the process will generally meet the customer requirement. Specifically, a value of 1.0 says that the specification limit closest to the mean lies at a value of three standard deviations from the mean, which implies a 0.135% (i.e. 1350 parts per million) defect rate for a normal distribution. (Note that a smaller percentage of additional defects could be expected due to parts exceeding the other specification limit, depending on how far that specification limit was from the mean).
Historically, a Cpk value of 1.3 or better was often required by customers, which provided a buffer zone equivalent to having the closer specification at 4 standard deviations from the mean. While a reduced defect rate is a possible outcome of the higher standard, it also reflected a realization that sampling error can lead to overly optimistic estimates of the capability index. Put simply, each sample taken from a process may not provide an accurate estimate of the true process mean, the process standard deviation, or the resulting capability index. (For further discussion of sampling error, please refer to an earlier article: Don’t Touch That Process-Improvement Dial!).
Confidence intervals are a means to quantify the error. Typically, a 95% confidence interval is used, which implies that 95% of the confidence intervals created from samples of this population will include the true Cpk. The confidence interval for Cpk will be wider for smaller sample sizes; the interval is wider for larger Cpk. Table 1 provides the approximate two-sided 95% confidence limits based on the total number of samples N and the estimated Cpk, assuming the process is in control and observations adequately modelled by a normal distribution.
Table 1. Two-sided 95% Confidence Limits on Cpk
|
Cpk \ N |
150 |
300 |
450 |
1000 |
|
0.7 |
0.10 |
0.07 |
0.06 |
0.04 |
|
0.8 |
0.11 |
0.07 |
0.06 |
0.04 |
|
0.9 |
0.12 |
0.08 |
0.07 |
0.04 |
|
1 |
0.13 |
0.09 |
0.07 |
0.05 |
|
1.1 |
0.14 |
0.10 |
0.08 |
0.05 |
|
1.2 |
0.15 |
0.10 |
0.08 |
0.06 |
|
1.3 |
0.16 |
0.11 |
0.09 |
0.06 |
|
1.4 |
0.17 |
0.12 |
0.10 |
0.06 |
|
1.5 |
0.18 |
0.13 |
0.10 |
0.07 |
The control chart of Figure 1 included 30 subgroups of size 5, for a total of 150 observations, so (from Table 1) the two-sided 95% confidence interval on the Cpk is 1.2 +- 0.15, or 1.05 to 1.35. To put that in perspective, the expected defect rate for the reported value of Cpk = 1.2 is 159 parts-per-million (ppm). If the actual Cpk is 1.05, the expected defect rate is 1100 ppm, a potential error in our defect estimate of nearly 600%!
Figure 1: Control chart of process data (SPC-PC IV Explorer software, copyright Quality America, Inc., by permission)

While these confidence intervals can help quantify sampling error, there are other sources of potential error in capability estimates that must be separately managed. Bias, for example, can occur if your sampling has excluded critical sources of variation. For example, if the capability estimate includes data from only a single machine, operator, supplier lot, day of the week, or some other source that is likely unknown to be an issue, then the estimate could be biased.
You might have noticed that the smallest sample size in Table 1 is 150. While you can mathematically calculate a capability index using fewer samples, you may be excluding data that provides a more complete picture of the process. Especially as a prediction tool, a meaningful capability index should include all the typical sources of variation that the process will experience. This necessitates data collection over a sufficient time period.
Statistically, constructing control charts with less than 150 observations is ill-advised, since you cannot calculate meaningful control limits with less data. You might be familiar with a “rule of thumb” suggesting 30-35 subgroups are necessary to establish control limits. This would be the suggested number of subgroups only when the subgroup size is 5 or more. Smaller subgroup sizes require more subgroups, and a total of 150 observations in 30 or more subgroups is a more reliable rule. (The issue is that the “constants” used to construct the control limits, such d2 and d3, only approach constants for a larger number of subgroups, such as 30 for a subgroup size of 5 or closer to 50 for a subgroup size of 3). While you might be tempted to use larger subgroup sizes, you then risk including special causes of variation within the subgroup, which makes the control limits wider than useful in detecting process shifts. Failing to detect process shifts will cause your estimate of process standard deviation to be elevated.
As you might have guessed, the control chart provides an extremely critical role in capability estimates. First and foremost, it provides the means to estimate process sigma, which is used to calculate the capability index. The control limits, which are calculated directly from the process standard deviation, are used to verify that the process is stable, because (IMPORTANT POINT) if the process is not stable then trying to estimate it with a single process capability index is futile. The capability prediction has no meaning for an unstable process. You cannot predict an unstable process.
Consider the control chart shown in Figure 2. While it has an identical capability index and histogram to the process shown in Figure 1, it is clearly a different process. The run test rule violations, evidenced by the circled subgroups, provide an indication that the process is trending, and thus, unstable. The capability index, as well as the histogram, ignore the process variation over time. It should be clear that a capability index without its accompanying control chart is misleading (at the least) if not negligent. Statistical control of the process is a requirement for calculating process capability, and it is imperative to demonstrate this stability before you can be confident in its calculation and interpretation. Without the control chart, you can be confident only in this: the capability index is meaningless.
Figure 2: Control chart of unstable process data (SPC-PC IV Explorer software, copyright Quality America, Inc., by permission)

Looking for a reprint of this article?
From high-res PDFs to custom plaques, order your copy today!


